2023-24 NBA ROI Recap: 1692 Units Net Profit
Not A Typo
With the 2024-25 NBA season about to kickoff, we thought it would be prudent to remind everybody about our performance last year. Here’s a graph tracking our 1692 units of ROI over the course of the 2023-24 NBA season. This graph includes all of our prop markets, which you can check out in the FAQ.
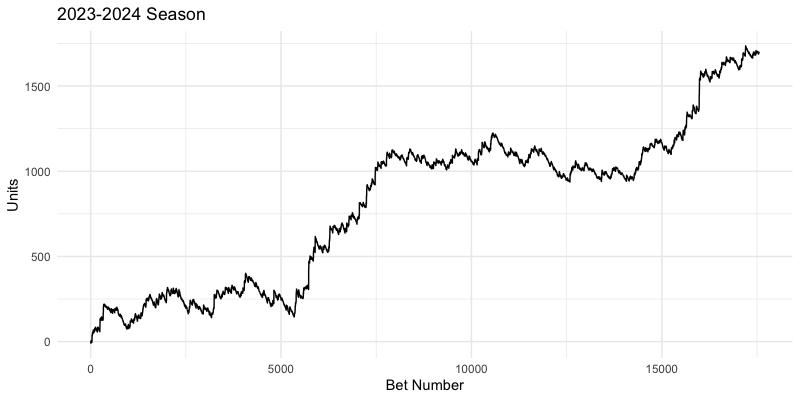
The horizontal axis is “bet number”, which is just the index of bets we’ve made - far left is the first bet we made of the season, far right is the last one. The vertical axis is “units returned” which just counts the NET units returned from the bet. When the line goes up, we’re winning, when it goes down, we’re losing.
Some things to call out:
Obviously this line is not flat, which means that we had ups and downs.
The line ends a LOT higher than when it began! 1692 units higher, in fact.
We make a LOT of bets - this chart included 17,558 data points!
While we had some plays that made the line go straight up (we’ll write some separate posts on those, but bless Noah Clowney), the majority of the return is grinding away with incremental wins.
This is the first of our recaps, but definitely not the last. Thanks a lot for reading, holler if you have any questions (@jimtheflash is the best way to find us), and please consider subscribing if you haven’t yet 🙏
(And if 1692 units of profit isn’t enough, well, idk what else we can say!)