How Do You Predict First Baskets? Part 3 of …
So Many Models

In the previous post on predicting first baskets, we walked through the data we use for the models. Next we’ll talk through the models themselves. This will get kinda long and nerdy!
We build a LOT of models. For each modeling problem, we typically build three unique kinds of models (e.g. regression, decision trees, splines) and combine them via a technique called ensembling. Ensemble models build off the idea of the wisdom of the crowds, a phenomena where often times the average estimate of something, like the weight of a cow, from a big crowd of people, is a better predictor of that thing than the estimates of experts. In ensemble models, we replace the crowd of people with a bunch of predictions from models, and try to do some smart weighting of the different input models as we get evidence about which models are most reliable.
But there’s more! Sometimes, the inputs to a model aren’t always available for every player or team - for instance, we can’t use any statistics that reference a previous season for rookies, or a 20-game average of a metric for a player or team who hasn’t played 20 games. So we build sets of models, called reduced models, to handle these different cases, and then use a process called reconciliation to align the outputs, which is important in cases where we’re using different models for different players in the same games.
Supporting all these models present a challenge for orchestration, i.e. figuring out which models to use in different situations, but has so far given us far stronger results than other approaches to the problem of predictors not always being available for every case that needs a prediction (like imputation).
So, to the models! Here’s that diagram again: 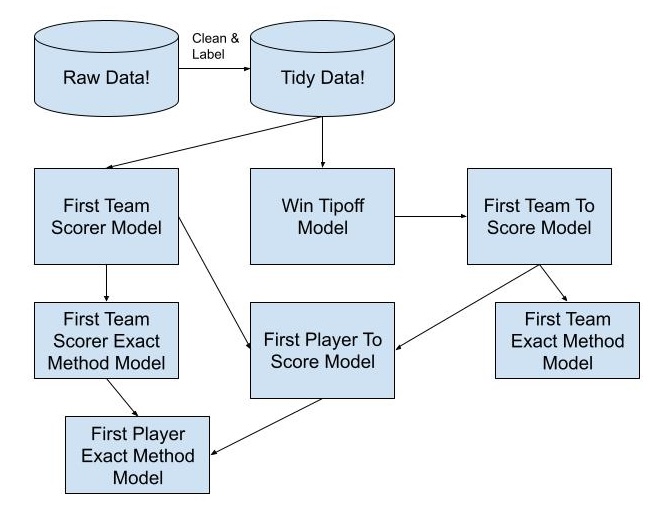
The first are the jump ball models, which predict the likelihood of a specific jumper to win the tip against another specific jumper, e.g. Anthony Davis to win the tip against Bam Adebayo or vice versa. A player’s win rate against a specific opponent is almost always the best predictor of the outcome here, but a number of other factors, like a player’s height, reach, vertical, and overall jump ball win rate are also useful pieces of information.
Once we’ve predicted the tipoff winner, we can predict which team will score first. These models use the output of the jump ball models, along with game lines and other team-level stats like offensive efficiency (adjusted for the expected lineup). One note, is that defensive factors rarely explain much variance in first team to score outcomes - there might be some lockdown defensive teams out there, but the majority of the time a team’s offensive production is most important. These are also the only models in our stack that use odds data from the books, because frankly the models are a lot better performing when we include them; in the future we’d prefer to remove the dependency on external odds estimates, but for now they work.
Independent from the jump ball and first team to score processes, we also model which player will score first for their team. This doesn’t require any knowledge of who will win the tipoff or which team scores first (we tested that). The most important features in our first team scorer models are focused on usage: players who have a lot of offensive touches early in the game tend to be more likely to score first, but this depends a great deal on who else is in the starting lineup that day and their expected usage.
This makes intuitive sense! For instance, if a player is typically a backup Center, they almost certainly have a low likelihood to score first in any given game; but if the starting Center is inactive and the backup moves into the starting lineup, the backup’s usage pattern has to be higher than what you’d expect in a “typical” game. Our data support that hypothesis and our models utilize it to a great advantage. (To be fair, the sportsbooks do this with their models too! We just do it better.)
At this point we have all the main ingredients for our player to score the first basket for the game models. The most important inputs for these models are, unsurprisingly, the output of the team to score first models and the output of the player to score first for their team models. Most of the other information about player and team performance is already baked into the previous modeling steps!
The last pieces to the modeling puzzle are the exact methods for first team to score, first team player, and first player overall, e.g. predicting which player or team will score first and also specifying that it will happen on a two pointer or a free throw or a dunk (different books have different methods available). The most important features of these models are their predecessor models, and shot type trends adjusted for different lineup combinations.
And there it is! We might do some more technical writeups on modeling tools and techniques later down the line, as well as some pieces about how we predict other first events in basketball games (like rebounds or steals). But the next post I’ll do is about how we find and quantify our edges to make play recommendations.
Thanks for reading all this, and if you haven’t yet, please subscribe to our discord server!